Understanding the spread of infectious diseases in populations is the key to controlling them. If the UK was facing a flu pandemic, how could we measure where the greatest spreading risk comes from? This information could help inform decisions on whether to impose travel restrictions or close schools.
Understanding the spread of infectious diseases in populations is the key to controlling them. If the UK was facing a flu pandemic, how could we measure where the greatest spreading risk comes from? This information could help inform decisions on whether to impose travel restrictions or close schools.
We would like to offer our metrics to the research community as a better tool to measure behaviour in dynamic networks.
Hyoungshick Kim
Think of the patterns of human contact that can spread infectious disease; you might be breathed on by a hundred people a day in meetings, on public transport and even in the street. These interactions create a highly dynamic network, in which new nodes (contact points), are added to the graph, some existing ones are removed, and in which edges (the lines that join the nodes) come and go too.
These are difficult concepts to grasp and the spread of diseases is just one of the many examples of visualising how networks rapidly spread into a complex mass of interactions.
Most analyses and models have assumed that networks are static, typically represented in graph form as a number of nodes connected by edges. For example, if a local council were to monitor the flow of traffic through a city, the roads would be modelled as a network and capacities would be assigned to the edges, which represent the number of lanes on the roads. Static network models would apply a network flow equation to determine the maximum traffic between any given pair of points.
Although this model would discover the maximum number of cars that can travel through a city in a single wave - if the cars all leave at the same time and get to any point with no delay - it would not be capable of plotting the time it would take for cars to travel and if cars delayed their departure.
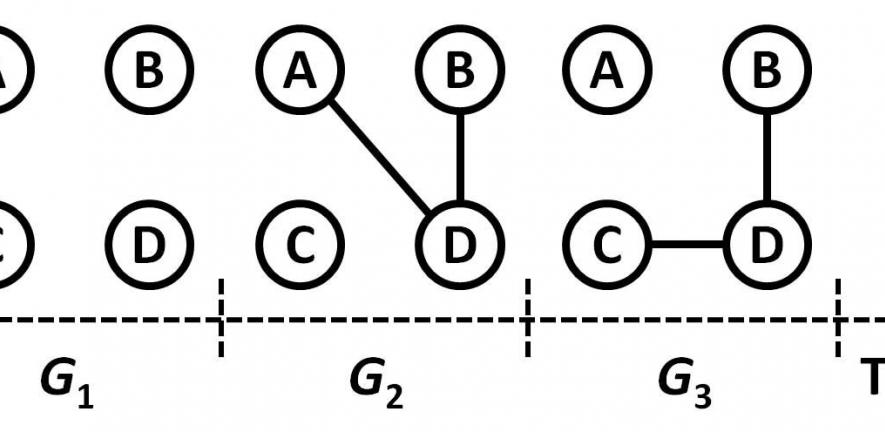
Now, scientists at the University of Cambridge’s Computer Laboratory have taken the understanding of standard graph theory one step further by designing a model that can plot the effects of mobility and interaction with the use of a time-ordered graph.
"We would like to offer our metrics to the research community as a better tool to measure behaviour in dynamic networks," said lead author Hyoungshick Kim, a PhD student in Professor Ross Anderson's research group.
The time-ordered graph reduces the complexity of a dynamic network and applies it to a static network by using directed flows. Directed flows allow for network properties to be extended; such as betweenness, which measures the influence a node has over the spread of information through the network (eg how influential a person is within a social network).
For example, in epidemiology, some possibly infective contacts between individuals are long term (friends, family) but many are fleeting (people in the street or the market place). Their relative importance may vary. The new model can be used to identify places or people that are the most influential for epidemics.

This work is licensed under a Creative Commons Licence. If you use this content on your site please link back to this page.


