For researchers at the University at Cambridge, recent storm damage is providing vital data that could help improve future flood warnings and emergency planning
For researchers at the University at Cambridge, recent storm damage is providing vital data that could help improve future flood warnings and emergency planning
These results could help improve early warning systems and evacuation planning
Tom Spencer
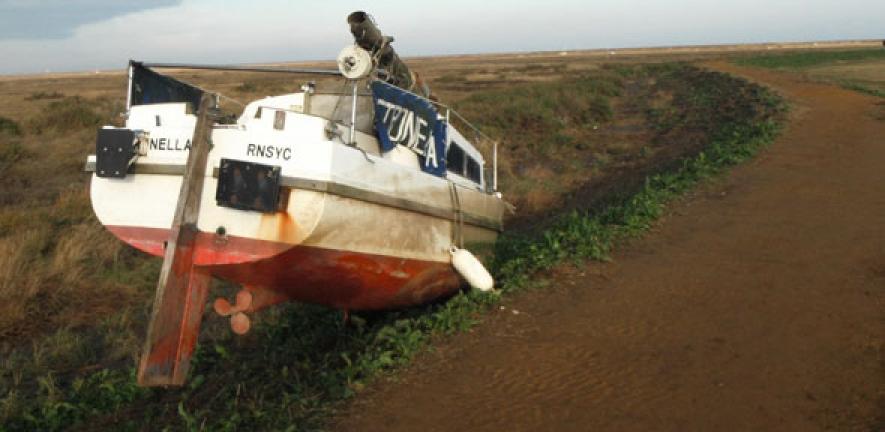
The wet and windy weather that has battered Britain’s coasts this winter has brought misery to many, but for researchers at the University at Cambridge the storm damage is providing vital data that could help improve future flood warnings and emergency planning.
On 5 December 2013, coastal communities along the North Norfolk coast were threatened by a significant storm surge – the result of low atmospheric pressure (which causes sea level to rise) combined with high winds pushing up the sea surface as they blow water towards the coast.
According to Dr Tom Spencer of the Department of Geography’s Cambridge Coastal Research Unit: “The southern North Sea is very vulnerable to storm surges because of its shallow water, and winds blowing from north to south funnel the sea into the narrowing basin near the Straits of Dover.”
Predicting the impact of storm surges on coastal areas like North Norfolk, which is lined with barrier islands and gravel spits – and cut by tidal inlets bordered by mudflats and saltmarshes, is challenging. To find out how these features affected the water levels and waves that hit the area’s coastal settlements during the storm, the team from Cambridge and Birkbeck, University of London took to the road.
Immediately after the surge, they travelled the 45km between Holme-next-the-Sea and Salthouse measuring maximum water levels with a satellite-based survey system able to resolve positions and heights to an accuracy of less than 50mm and often less than 20mm. “We looked for debris lines, erosion marks on earthen banks and floodlines on buildings – or in some cases car windscreens,” Dr Spencer explained.
They found that maximum surge heights here differed by almost 2m, depending on whether the site was exposed or sheltered, differences much larger than previously thought. “At some sites this was the critical difference between a business or a home being flooded or not,” said Dr Spencer. If these results can be incorporated into surge models and flood forecasts, they could help improve early warning systems and evacuation planning.”
The December 2013 event that Dr Spencer studied came almost exactly 60 years after the disastrous storm that hit the region in 1953, claiming more than 2,000 lives around the southern North Sea – the largest death toll from flooding in Europe for 100 years.
“Looking at the atmospheric pressure charts, the 2013 and the 1953 events look similar: both were characterised by a deep low pressure system that came down the long axis of the North Sea. But while the 2013 storm was short-lived, producing waves of around 3.8m offshore from North Norfolk, in 1953 gale force winds blew for several days ahead of the surge, producing waves probably close to 8m high off eastern England,” he says.
Like the 2013 event, the 1953 storm arrived under cover of darkness. But unlike 2013, it hit over the weekend, with devastating results.
“Most people in the UK and The Netherlands were asleep in bed when floodwaters broke into their houses, many of which were single storey chalets and bungalows. Some people managed to get onto their roofs but, with the storm still raging, they died from exposure or slid into the sea,” he said. “In The Netherlands, where over 1,800 lives were lost, the radio ceased transmitting at midnight on the Saturday and although warnings were issued by telegram, these arrived at offices that were shut over the weekend.”
Much was learned from the 1953 storm: coastal defences were heightened and strengthened, and there have been major advances in storm surge forecasting and emergency planning. But, as Dr Spencer’s results show, there are still lessons to be learned from today’s floods that could help prevent tomorrow’s victims.
The team’s initial assessment is published in Nature.

This work is licensed under a Creative Commons Licence. If you use this content on your site please link back to this page.


