Sea change for Hull
With a changing climate and rising sea levels putting cities at risk of flooding, it’s crucial for planners to increase their cities’ resilience. A new tool has been developed to help them – and it started with the throwing of a thousand virtual hexagons over Hull.
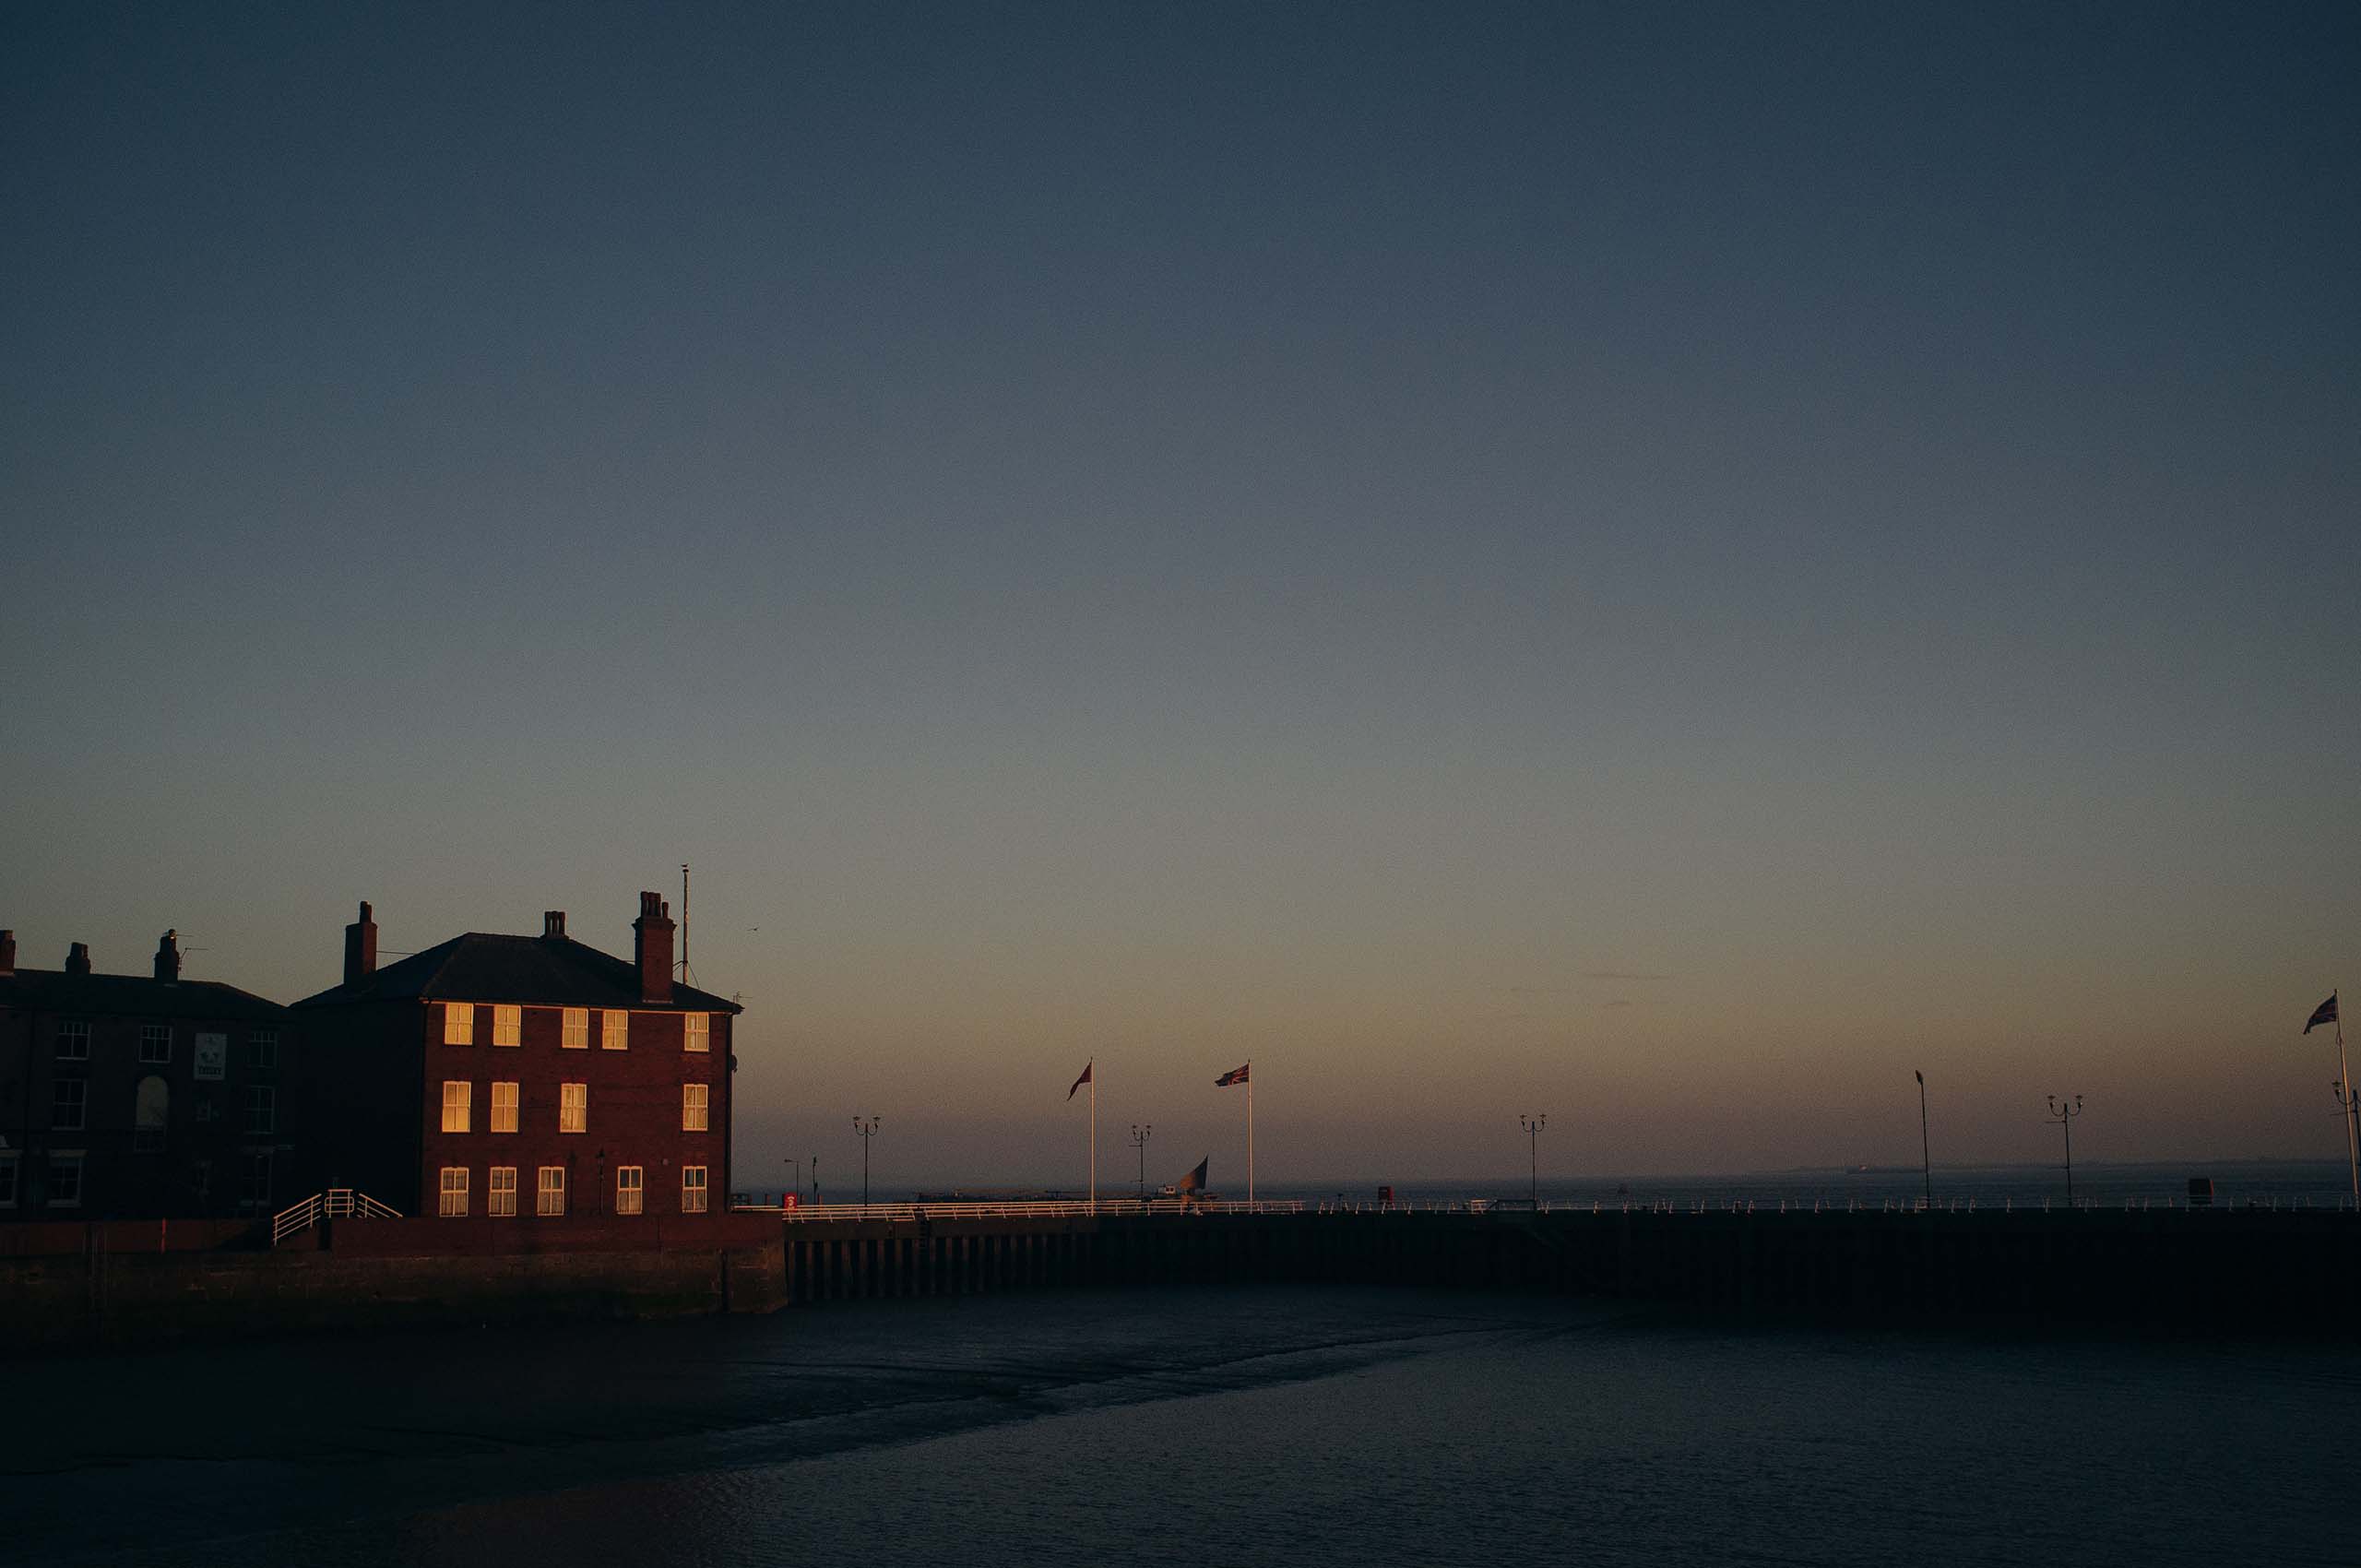

Low lying, at risk from the sea, river and surface water, the UK’s second biggest flood risk after London... It’s little wonder that decision makers, environmental agencies and residents are worried about the long-term sustainable future of the city of Hull.
On 5 December 2013, the largest tidal surge ever was recorded in the Humber. Around 1,100 properties and over 7,000 hectares of land were flooded, impacting industry and infrastructure around the estuary, and affecting trade, transport and production.
Before that, on 25 June 2007, the city’s drainage systems were overwhelmed on the wettest day in one of the wettest months in living memory. More than 10,000 homes were evacuated, almost all of Hull’s 98 schools were damaged and a life was tragically lost. The cost of repair across the city was put at more than £40m.
“These ‘once-in-a-lifetime’ flooding events will become more frequent as sea levels rise and we experience more storms,” says Mike Dobson, who works for Arup, global specialists in the sustainable built environment, and spent 15 years working in the Humber area for the Environment Agency.
“It’s vital that places like Hull make informed decisions on how best to reduce risk and increase resilience.”
Mike Dobson, Arup
“Fortunately there’s a wealth of climate data available,” says Professor Tom Spencer, Director of the Cambridge Coastal Research Unit in the Department of Geography. “Ideally you’d feed this high-spec climate science modelling into informed decision making.”
But that’s not straightforward, Spencer explains: “It’s a very complex set of tasks which requires a lot of resource – and most organisations just don’t have that. So what tends to happen is everything is over-simplified and only a small number of possible scenarios are considered – not enough to build in the uncertainties of the climate changes we face.”
Dobson and Spencer, together with Steven Downie, a Fluid Dynamics specialist in Arup’s Technology and Research team, plus researchers at the National Oceanography Centre, set out to change this.
They developed a new digital tool to communicate the impact of sea-level rise on flood risk. Developed as a web-based portal, the sea-level rise tool can be used to understand the economic impact of tens of thousands of potential scenarios of rising seas and mitigation activities. It’s the first time the full scope of the Intergovernmental Panel on Climate Change (IPCC) sea-level rise projections can be seen in an interactive way.
The team was supported by the Environment Agency, which acted as stakeholder and provided vital data to enable a case study based on Hull.
“I’ve been working in flood risk management for over 20 years trying to help make good decisions,” says Dobson. “It’s often pretty static – lots of modelling, lots of economics presented in a static report with conclusions at the end. We wanted to see what else was possible and bring it to life. Cambridge University managed to unblock the complex modelling which allowed us to do that.”
Rising sea levels

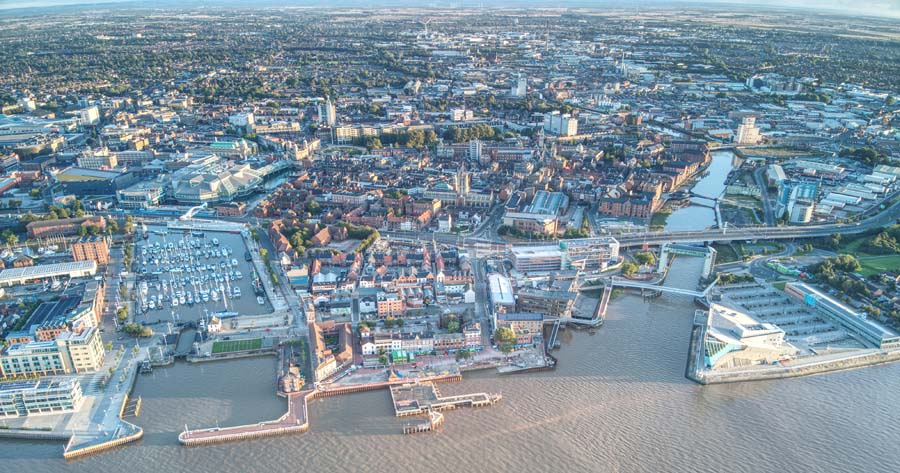
“Hull is low lying – it’s similar to New Orleans in many ways due to its low lying nature on the coast – and there are 100,000 properties potentially at risk from the most extreme weather events,” says Dobson.
As much as 90% of the city is below the high-tide line. The Environment Agency has warned that, with the changing climate, water levels in the Humber Estuary could rise by over 1m in the next century.
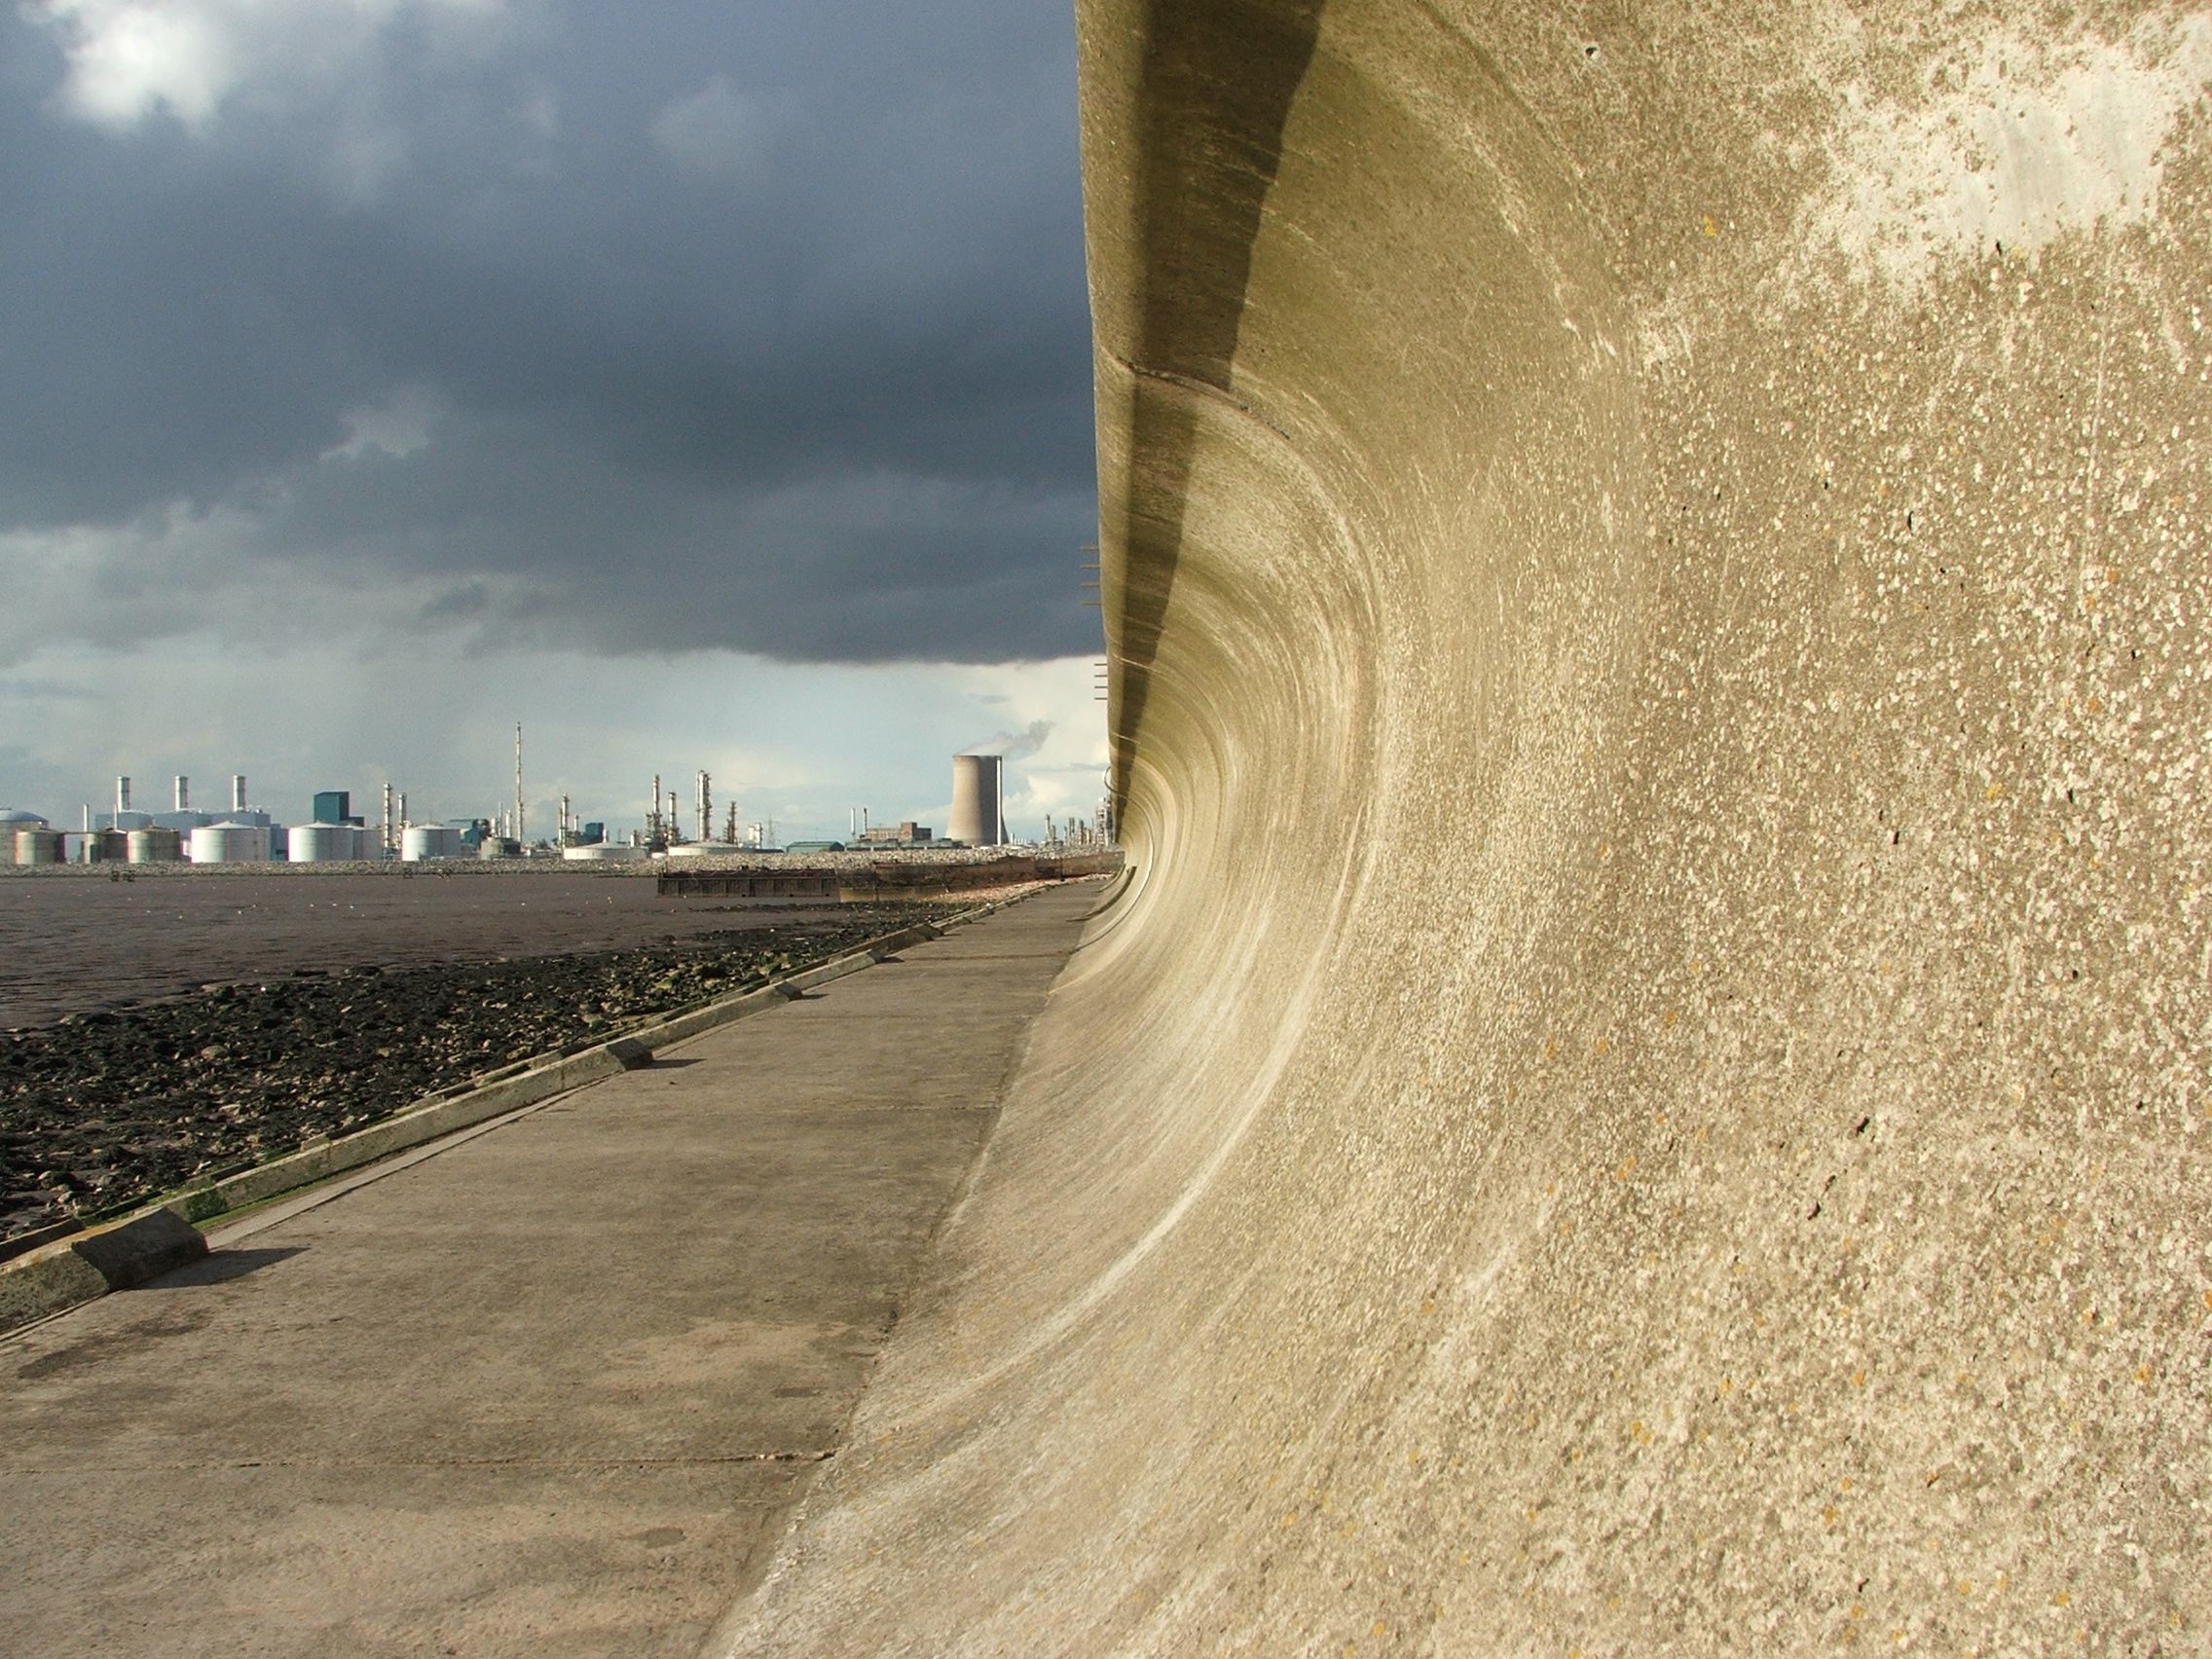
In March 2022, a scheme of new flood defences was opened in Hull funded by £42 million from the government. Then in May 2022, an Environment Agency project to create a large ‘aquagreen’ that will reduce flood risk to over 870 properties and key infrastructure in east Hull began.
“These measures are key elements that reduce the likelihood of flooding to homes, schools and businesses throughout Hull,” explains Dr Susan Manson, Humber Technical Manager at the Environment Agency. “The size and scale of investment in the tidal defences has been an important driver for investor confidence such as the Freeport bid.” (Freeports are a government programme that aim to create economic activity near shipping ports or airports.)

As much as 90% of Hull is below the high-tide line
As much as 90% of Hull is below the high-tide line
But we’re facing “a losing battle” against sea-level rise says Spencer: "We’re going to see more extremes and those extremes from a coastal point of view are going to be sitting on top of a rising baseline which is going to increase as we move towards the end of the century – not just in Hull but everywhere.”
Spencer’s team at the Cambridge Coastal Research Unit are experts on coastal environments and the dynamics of sea-level rise. Their work has taken them all over the UK, from the salt marshes of Norfolk and Essex, to the estuaries of Suffolk and Lancashire, and the embayments of The Wash and Morecambe Bay, working with communities and organisations to manage the coast for the future.
And so Spencer, Dobson, Downie and their partner organisations were tasked with finding a better way to understand and communicate the impact of rising sea levels as part of the EuroSea programme. EuroSea is a large-scale project to improve the European ocean observing and forecasting system, involving 55 partners from 16 countries and funded with Euro 12.3m from the European Union’s Horizon research and innovation programme.
New digital tool

Typically, flood risk assessments only consider a limited band of uncertainties around sea-level rise. The challenge with managing this risk is that as projections get further from the present day, the uncertainty of the prediction increases.
There’s an added problem that discount rates applied in economic Net Present Value financial calculations also mean that the impacts of worst-case scenarios later in the century have limited impact on decisions we are taking now.
Spencer and his colleague Dr Elizabeth Christie started with detailed sea-level rise prediction information from the UK Climate Projections data in 2018 (UKCP18) to model the impact of climate change.
Then they developed a framework that incorporates sea-level rise uncertainty into coastal flood risk assessment by streamlining the process of modelling sea levels, wave overtopping and flood spreading on land. This allows all the uncertainty to be propagated through to the calculation of risk, driven by economic damages.
The outputs were in a coarse gridded format initially, but Spencer and Christie worked with CADA Consulting, the Data Scientists supporting Arup, to reduce the resolution to a level that would allow the speed of processing required for live user interaction.
The conclusion was to divide Hull into 1,000 virtual hexagons 400m wide from corner to corner. This lower resolution at ground level meant they could speed up the processing of a huge number of results from different sea-level scenarios and their economic impacts in real-time using a web-based tool.

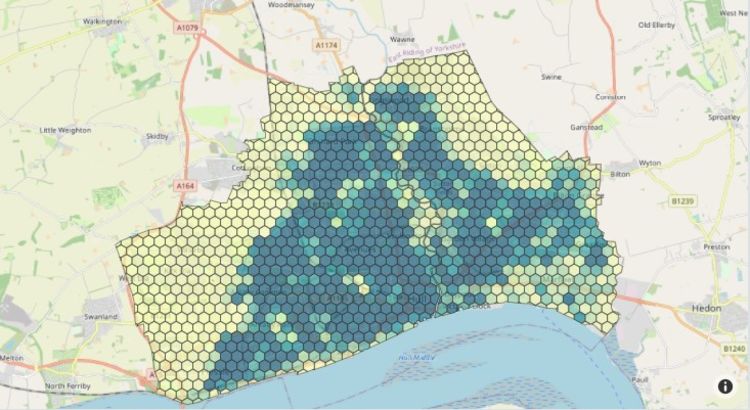
Hexagons used in computer simulation
Hexagons used in computer simulation
“It was the first time we’d ever done anything that has actually captured the uncertainties in a way that allows you to talk to policymakers,” says Spencer.
By the end of their research, the Cambridge team was running in the order of 10 million data points relating to 21,300 scenarios with 122 increments of sea-level rise and seven extreme water levels in just a few hours.
Throughout the project, the team valued the input of the Environment Agency: “they were an incredibly important part of this project to make sure what we were doing was sense checked and was potentially useful for users at the end,” says Dobson.
“Cambridge University did the analytical heavy lifting,” adds Downie. “As a result, they could statistically describe a really broad spectrum of scenarios we were able turn into a prototype tool that allows users to delve into the data by toggling variables like time, storms and tides, defences and so on – and then compare outcomes in terms of scale of flooding across a geographical area.”

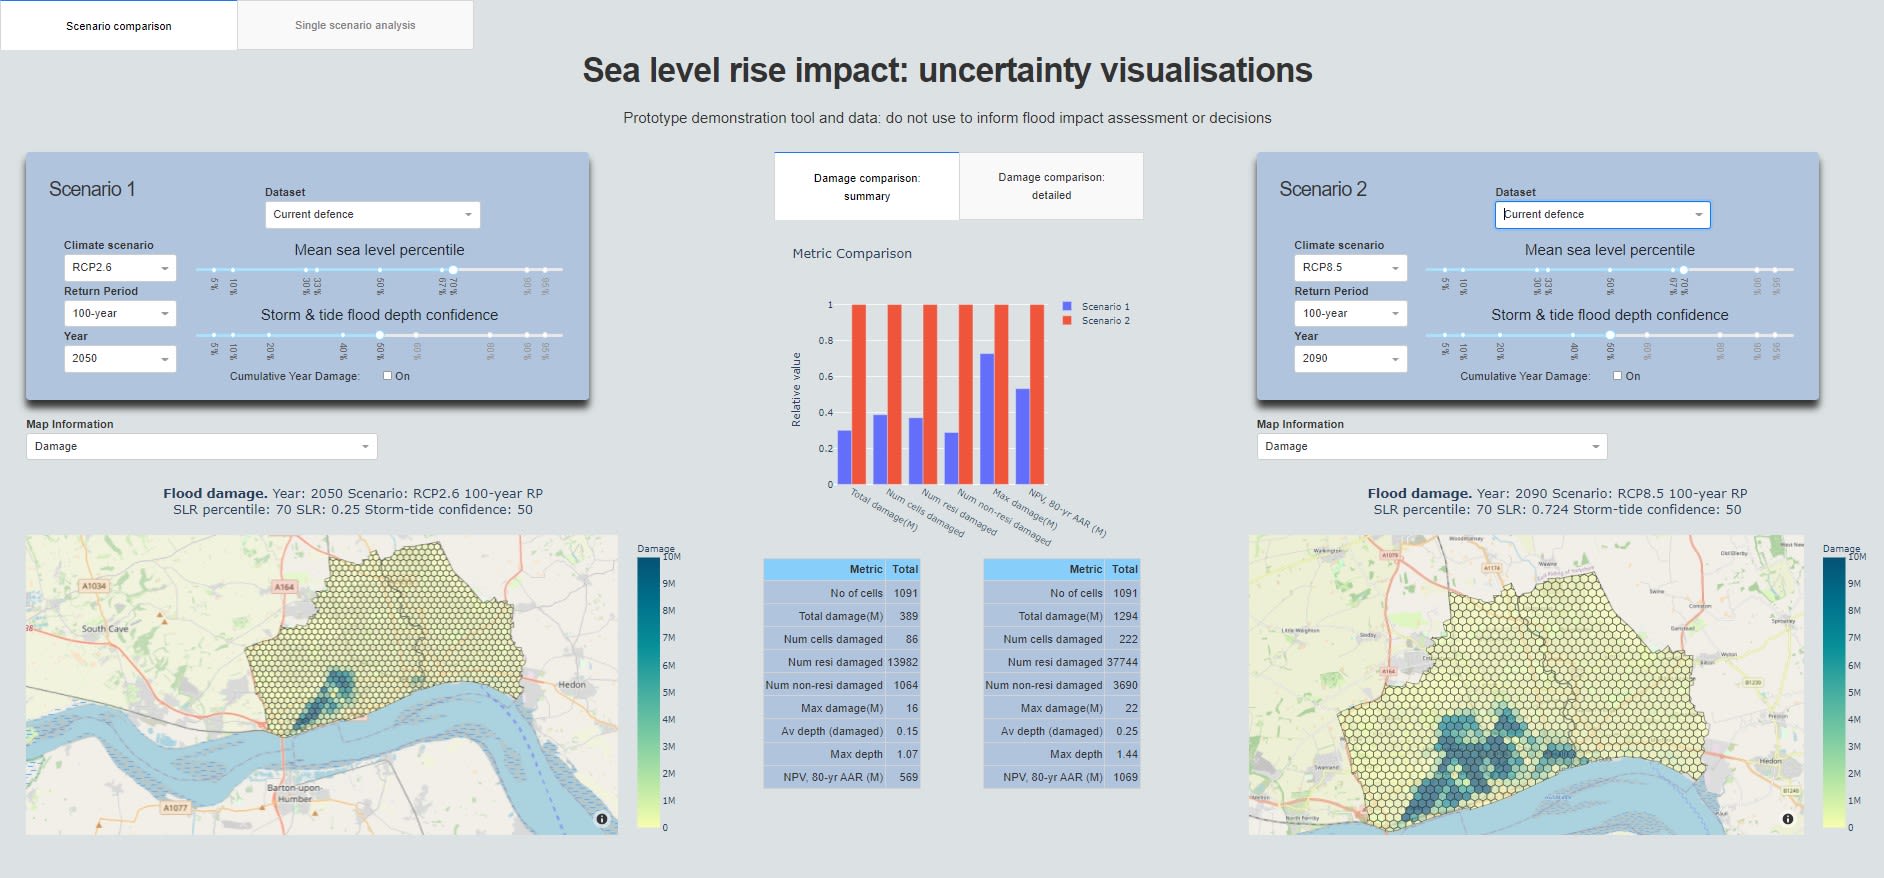
Sea-level rise impact tool prototype
Sea-level rise impact tool prototype
Beyond Hull


The Cambridge modelling and the sea-level rise insights tool has given the Arup team new levels of data and new opportunities to improve insight for decision makers.
Can it be applied in places beyond Hull? ‘Yes’ says Dobson – wherever local levels of sea and land are known. “We’ve worked with Cambridge to design the whole process to be replicable. We want it to be globally applicable.”
The team don’t see the tool as a replacement for detailed modelling to design defence levels, but they see real potential for it to be used as a scoping tool to set the boundaries of detailed modelling. In other words, using the tool to understand which scenarios identified by the IPCC are most important for a location and then spending often limited resources to understand the detail where it is needed.
Dobson sees the tool being applied to towns, cities, regions and even small countries around the world so that they can make better early-stage decisions to prepare for climate change and, just as important, help explain these decisions to the public. Manson also sees its potential in facilitating conversations about resilience and adaptation in line with the National Flood and Coastal Erosion Risk Management Strategy.
They acknowledge that there will be a play off between the needs of coastal decision makers, who may want more detail, and those seeking to communicate to the public, which warrants more visualisation. But both of these requirements add processing time, slow the calculations, making interaction less dynamic. “So where is the balance of speed vs need?” poses Dobson. “This is something to be explored in future.”
Meanwhile, the team has been spreading the word to UK policymakers through a Parliamentary and Scientific Committee and, with Spencer and Downie, at a United Nations interactive workshop as part of The Ocean Decade - The Science we need for the Ocean we want.
“The power in what we’ve done is that we’ve brought all of the science through from the front end through to decision makers with the visualisation prototype,” says Dobson.
“For the first time, decision makers can actually see the impacts of some of those more extreme projections and can start to make some more informed decisions.”
Mike Dobson, Arup
“This work is about the huge decisions that society has to make about adapting for climate change,” adds Downie. “We just don’t know how things are going to play out and we’re only going to get a few chances to get these things right. It’s simply better to make good decisions and this tool will help this by capturing future sea rises in the economic decision process.”
This research was funded by the EuroSea project, which received funding from the European Union's Horizon 2020 research and innovation programme under grant agreement No 862626.
Published 16 December 2022
Words: Louise Walsh
Design: Charis Goodyear
Photographs:
Building overlooking the Humber: Stuart Wrightson / Moment via Getty Images
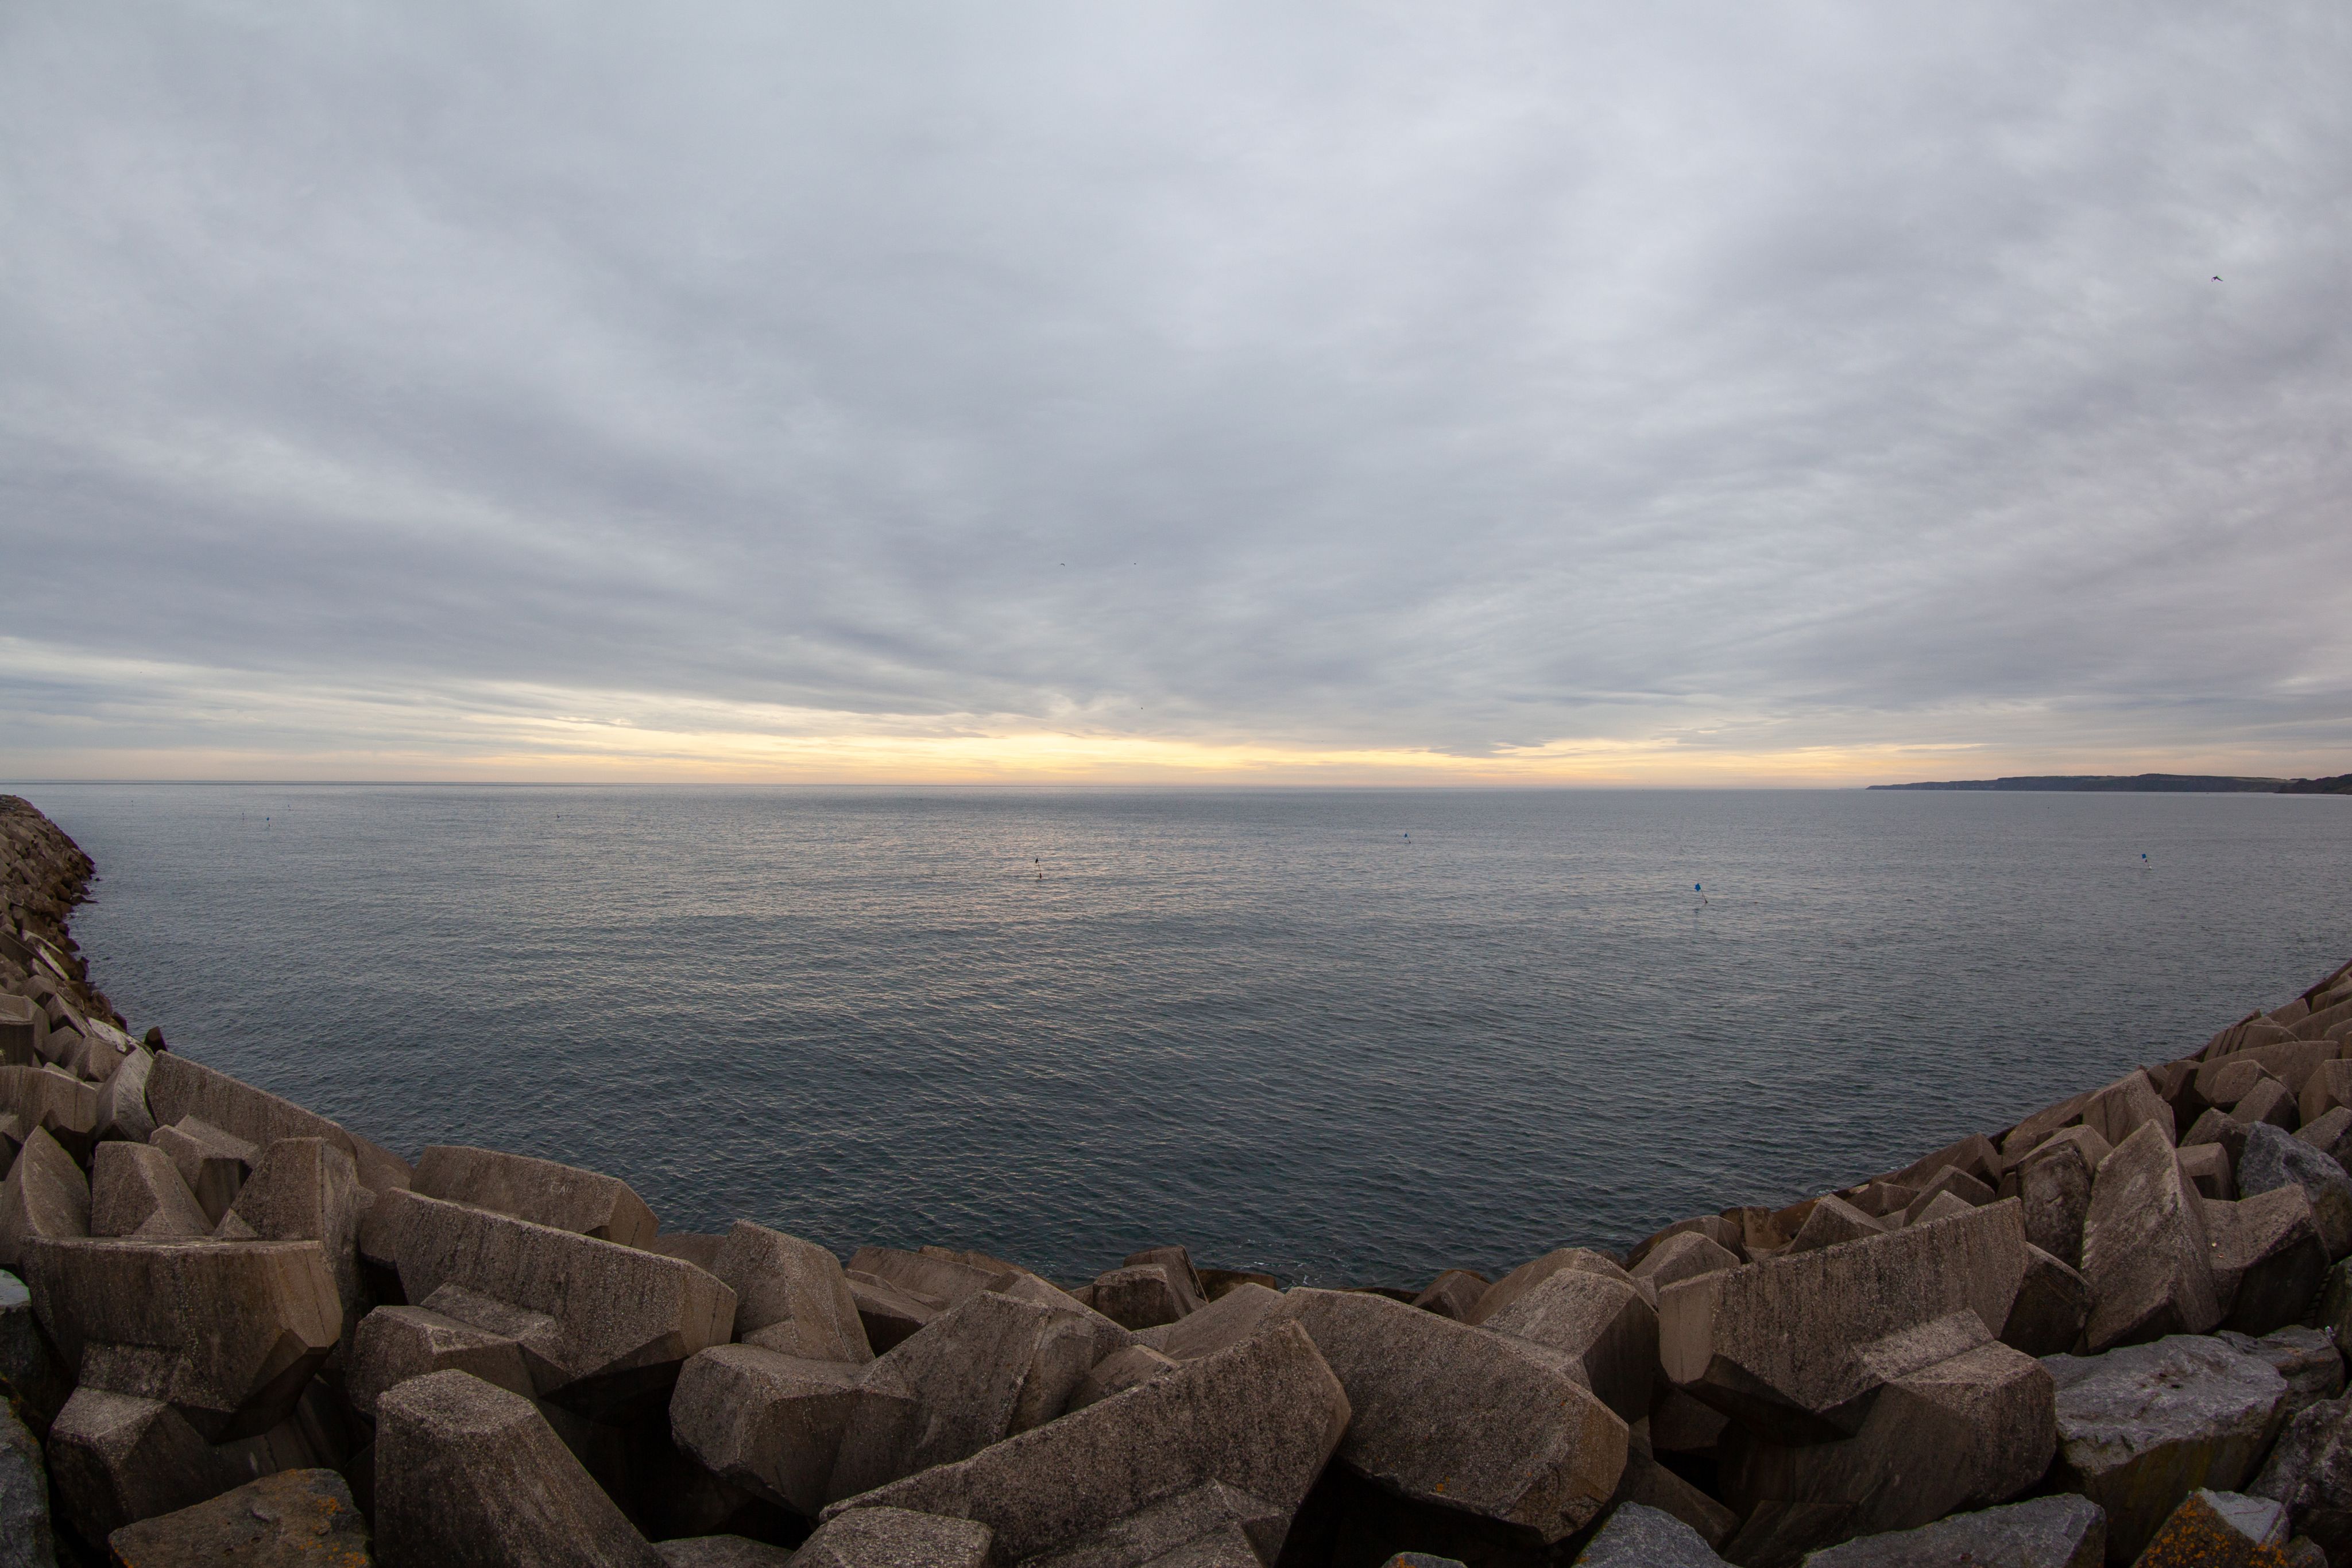
North England Coastline: Geraint Rowland Photography / Moment via Getty Images
Drone Aerial Photo Of Kingston-Upon-Hull: Andy Medcalf/EyeEm/Getty
Paull sea defences: Steve Roe - stephenroe.co.uk / Moment via Getty Images
Humber Bridge at twilight: hutchyb / E+ via getty Images
Computer simulation images: Arup
The text in this work is licensed under a Creative Commons Attribution 4.0 International License