The last 100 years have seen several governments introduce austerity measures to try to balance the books. Duncan Needham, a Phd candidate in the Centre for Financial History, compares past and present, concluding that current public spending cuts are inhibiting the growth we need.
The last 100 years have seen several governments introduce austerity measures to try to balance the books. Duncan Needham, a Phd candidate in the Centre for Financial History, compares past and present, concluding that current public spending cuts are inhibiting the growth we need.
The size of the current task most closely resembles that of 1931, when the cuts fell principally on the unemployed.
Duncan Needham, Centre for Financial History
In May 2010, Britain’s first coalition government since the Second World War announced that its primary objective was to reduce the deficit, then running at 11 per cent as the public sector spent £156 billion more than it raised in taxes. Six weeks later, the Chancellor, George Osborne, increased the spending cuts and tax hikes inherited from the Labour Government to £113 billion over five years, with the largest single adjustment to fall on welfare recipients. The Chancellor aimed to balance the budget by 2016, by which time public sector debt would be declining as a percentage of Gross Domestic Product (GDP). He also plans to reduce the public sector’s share of the economy from 48 per cent to 39.5 per cent.
While Osborne is keen to stress the unique nature of the current crisis, we have been here before – not once but several times. In 1922, a previous Conservative-Liberal coalition cut public spending by 9 per cent, with most of the reduction falling within the first year. In this post-war era, pressure came from the ‘squeezed middle’ as millions of households that had begun paying income tax during the First World War latched on to a Daily Mail campaign to root out ‘waste’ in the public sector. Before the war, the basic rate of income tax was 8 per cent. In 1922 it was still at its wartime high of 30 per cent as the Government built ‘homes for heroes’ and widened education provision. The Geddes Committee, appointed by the Prime Minister, Lloyd George, recommended that spending be cut by 10 per cent, a third to come from reduced naval expenditure, with education taking the second largest cut.
These cuts, although watered down by Cabinet, allowed the Chancellor, Sir Robert Horne, to achieve his primary aim of reducing income tax, from 30 per cent to 25 per cent. They also contributed to a miserable decade for the British economy. While America enjoyed the ‘Roaring Twenties’ and a long stock market boom that finally broke with the 1929 Wall Street Crash, Britain endured a General Strike as workers protested against wage cuts, and high unemployment, particularly in ‘Outer Britain’ as the old industries of the industrial revolution (cotton, coal and iron) suffered depressed demand.
With the global depression lowering tax revenue and increasing unemployment after the Wall Street crash, the government was in deficit by 1931. The economic orthodoxy of the day meant that the budget simply had to balance if the pound were to remain on the Gold Standard. The May Committee, appointed to identify savings, estimated that the shortfall for 1931 would be 5 per cent of public spending, rising to 9 per cent in 1932. The Committee decided that the burden of adjustment should fall on the unemployed. While unemployment benefit had not changed since 1928, the cost of living had fallen. The Chancellor was advised to cut benefits by 20 per cent, taking them just below 1928 levels in real terms. Once again, education was to be the second major source of savings.
The minority Labour Government was unable to agree on the cuts and collapsed in August 1931. The successor National Government (another Conservative-dominated coalition) introduced an emergency Budget in September which eliminated the deficit, now estimated at 12 per cent of public spending, through a combination of tax increases, spending cuts, and debt rescheduling. The largest saving came from unemployment benefit, where a 10 per cent cut was combined with increased insurance contributions. The Government also announced public sector wage cuts. These fell particularly onerously on junior naval personnel, who were asked to take a 25 per cent wage cut. When they read about this in the newspapers, part of the British fleet mutinied. As news of the mutiny spread, the pound came under speculative attack, forcing Britain off the Gold Standard. So, while the 1931 cuts failed in their primary objective of keeping the pound on the Gold Standard, coming off gold allowed the authorities to direct their attention to the domestic economy, laying the foundations for the 1930s recovery with looser monetary policy.
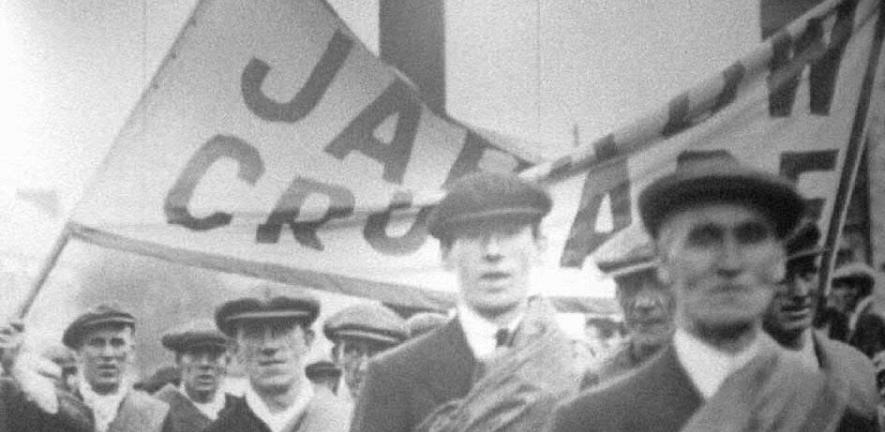
The defining image of the 1930s is the Jarrow March, as unemployed workers walked from the North East to London in protest at their plight. But for those who held on to their jobs, it was a relatively good decade as strong economic growth raised living standards.
The 1930s recovery was sustained by rearmament and spending on the Second World War. After adjusting to a peacetime footing in the late 1940s, Britain enjoyed a long post-war boom, which came to an abrupt end with the 1973 oil shock. While most industrial nations reduced spending to offset the increased cost of oil imports, the British decided to ‘tunnel through’ to North Sea oil production, due to come on stream within five years. This meant higher borrowing. In 1975, the government deficit was over 10 per cent. There was also a balance of payments deficit to finance. With a huge loan from the leading central banks falling due in December 1976, and no foreign currency reserves to repay it, the Government had little alternative but to ask the International Monetary Fund (IMF) for assistance. Having already granted two separate loans to Britain in late 1975, and concerned that public borrowing was ‘crowding out’ private enterprise, the Fund had left the Chancellor, Denis Healey, in no doubt that further assistance would be conditional on his lowering the deficit.
Despite a round of cuts in July 1976, confidence remained low and, with sterling in freefall, Britain announced its eleventh visit to the IMF. After several weeks of tense negotiations, Healey agreed to limit the deficit to £8.7 billion in 1977 and £8.6 billion in 1978 (still more than 10 per cent of public spending), contingent upon the economy growing by 3.5 per cent. This meant a further 3 per cent of cuts, spread over two years and across several departments, with defence and capital expenditure on roads, schools and housing bearing the brunt. In the event, the confidence effect of the IMF’s ‘good housekeeping seal of approval’, combined with the measures already taken, saw the British economy achieve robust growth in 1977 and 1978.
What do these episodes tell us about the situation today? The table shows that the current austerity outweighs all previous episodes as a percentage of GDP. Apart from 1922, when spending cuts were used to finance lower taxes, the burden of adjustment falls more heavily on spending than taxation.
|
1922 |
1931 |
1976 |
2010 |
|
| Fiscal consolidation/GDP |
3% |
4% |
1% |
6% |
| Budget deficit |
3% |
12% |
7% |
10% |
| Total public debt/GDP |
171% |
171% |
45% |
60% |
| Debt servicing cost/GDP |
9% |
9% |
4% |
2% |
| Spending cuts/tax rises |
3:-1 |
7:6 |
2:1 |
3:1 |
The size of the current task most closely resembles that of 1931, when the cuts fell principally on the unemployed. Today, Osborne deploys the same argument: that benefit claimants have done better out of cost-of-living adjustments than the working population. However, the differences are stark. With huge war loans to service in 1922 and 1931, interest payments took up a greater proportion of public spending. By contrast, servicing the debt presents few difficulties today. As the graph shows, the current level of public debt is modest by historical standards. Indeed, with ten-year Government bonds currently paying around 2 per cent, demand for UK debt appears to be outstripping supply. The government currently spends 3 per cent of GDP on servicing the debt, versus a historical average of nearly 5 per cent.
UK public debt/GDP since the Industrial Revolution
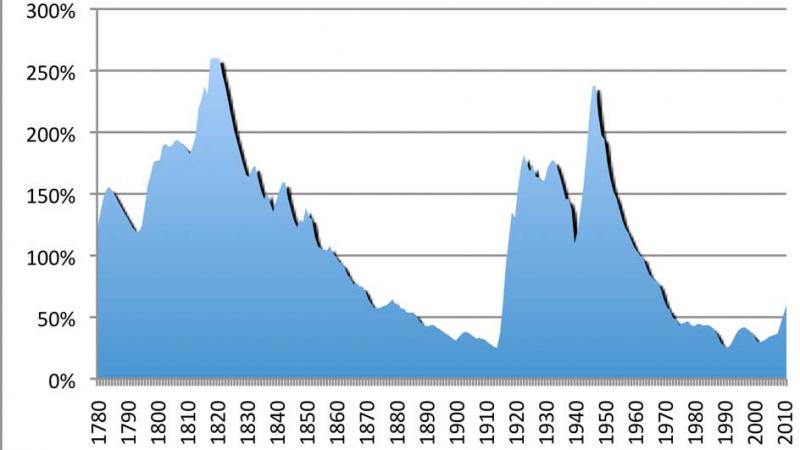
In 1931 the burden was split almost equally between spending cuts and higher taxes. By contrast, Osborne wants spending cuts to take 77 per cent of the adjustment, citing academic work suggesting that cuts are less damaging to growth than tax rises. This is critical because it is growth that will ultimately decide the outcome. As Samuel Brittan of the Financial Times recently pointed out “if we have a normal economic recovery the red ink will diminish remarkably quickly. It we don’t, it won’t”. Twenty-five years of strong growth after the Second World War reduced public debt from 238 per cent to 50 per cent of GDP. Growth, not cuts, reduced a similar deficit in 1977-78 when the second year of cuts was contingent upon robust economic expansion.
Currently, the auspices are not good. The Office for Budget Responsibility now believes that the economy shrank in 2012, after predicting 2.8 per cent growth in June 2010. It has also downgraded its growth estimates to 2015, forcing the Chancellor to postpone balancing the budget until after the next General Election, by which time, on current estimates, public sector debt will be 80 per cent, 20 points higher than when the Coalition Government took office.
Reflecting upon the failure of monetarism in the early 1980s, Nigel Lawson quotes Robert Burns, ‘The best-laid schemes o' mice an' men/Gang aft agley’. By the time he comes to write his memoirs, George Osborne may well share these sentiments.
Duncan Needham worked as a bond trader at JP Morgan and a fund manager at Cairn Capital before coming to Cambridge to take a PhD. His research focuses on UK economic policy from the 1960s to the 1980s.

This work is licensed under a Creative Commons Licence. If you use this content on your site please link back to this page.


